
Modeling spatial non-stationarity with multiscale geographically weighted regression
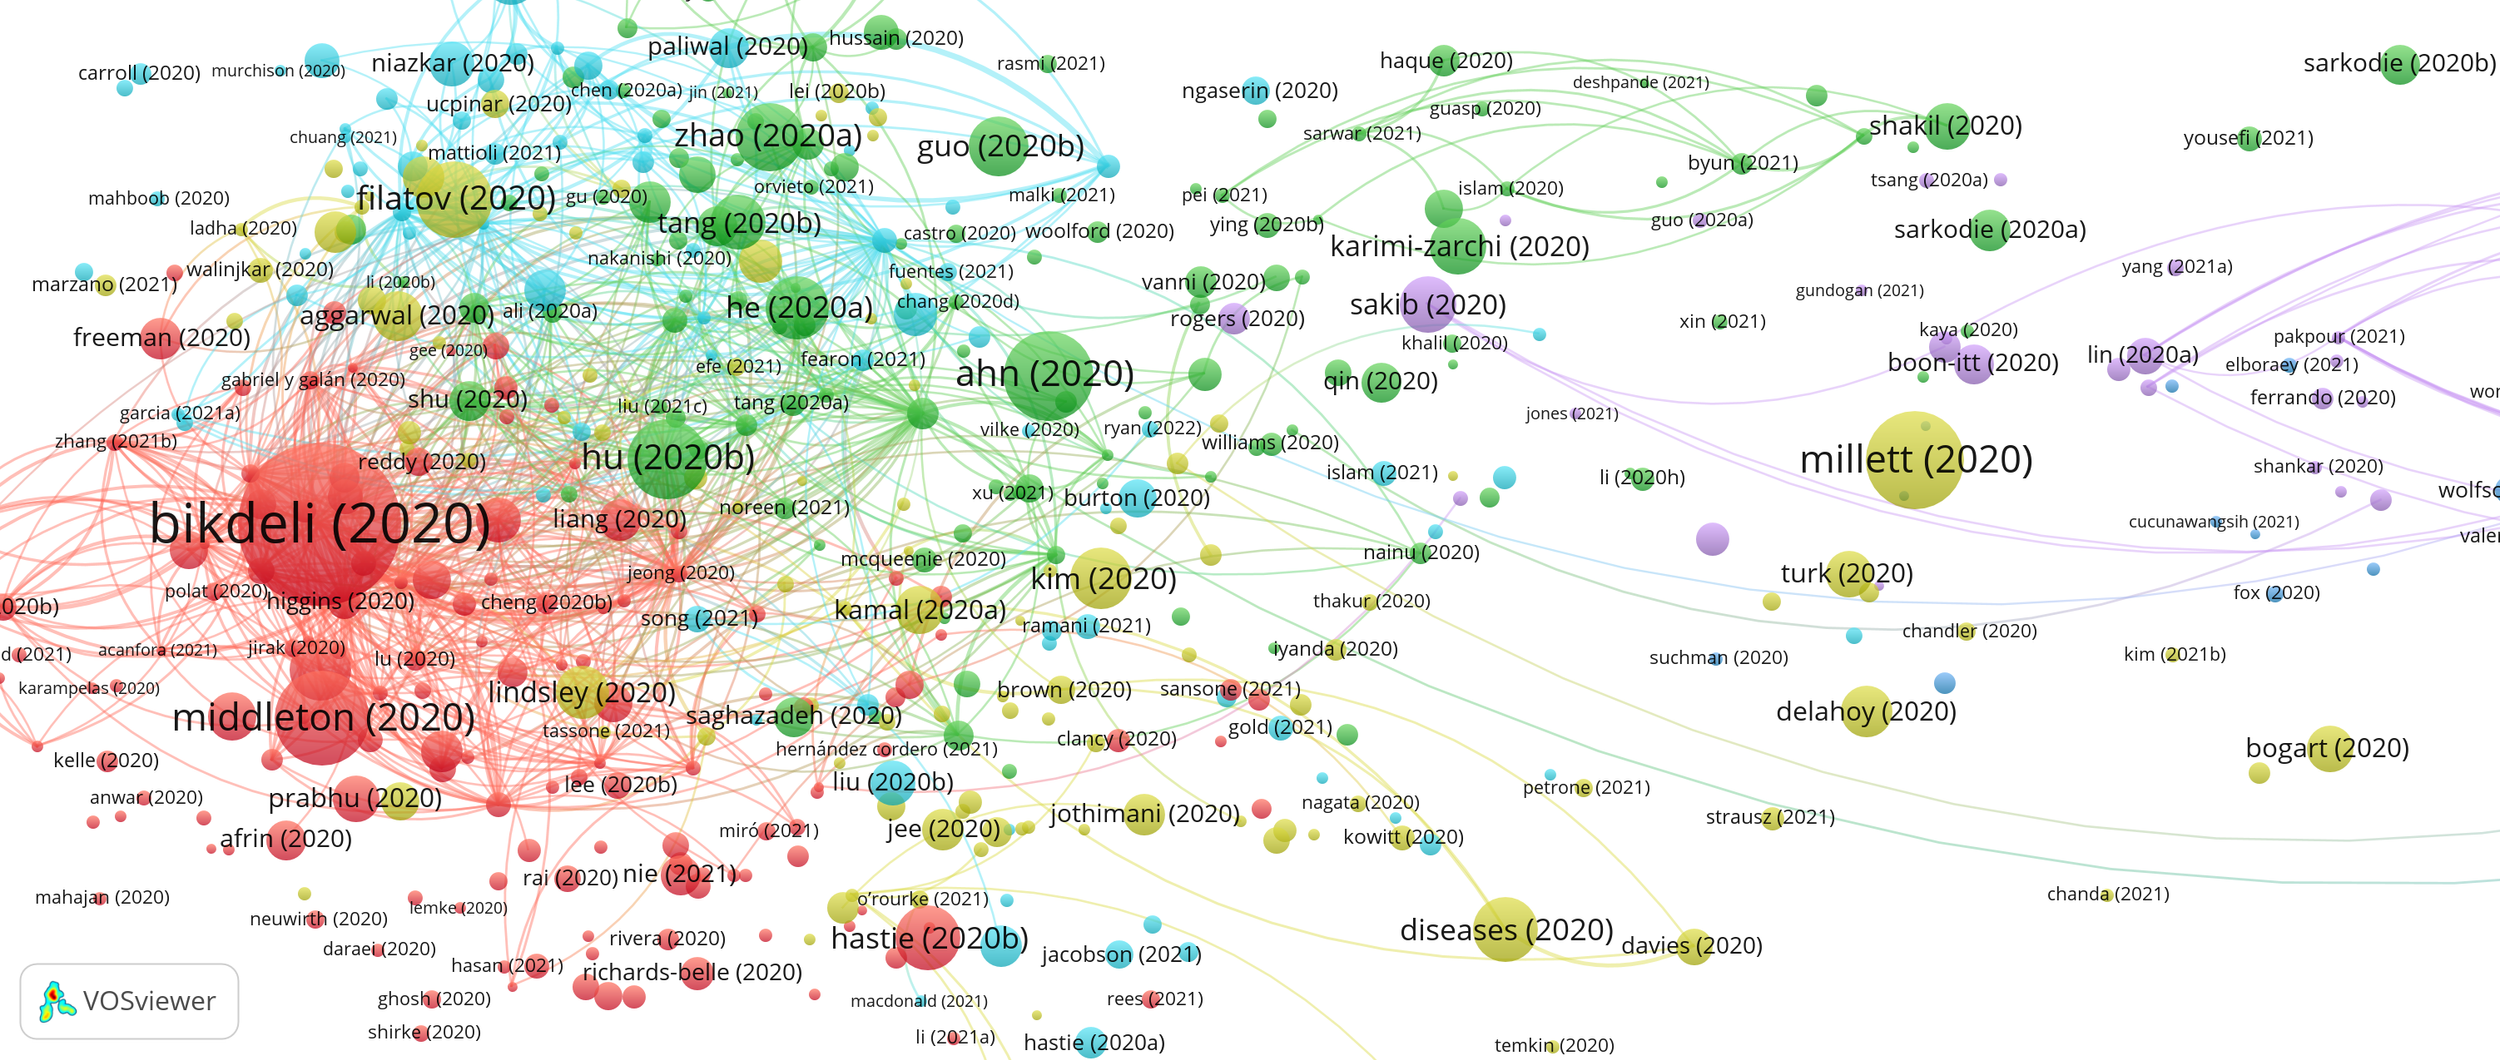
Mapping scientific landscapes. Bibliometric analysis of COVID-19 research
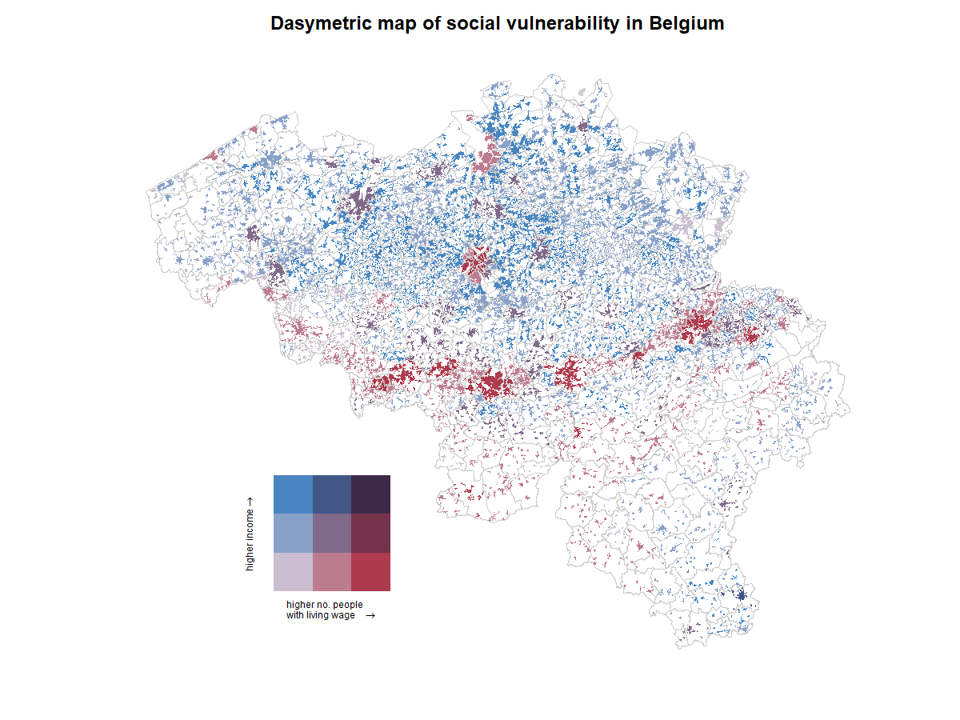
A dasymetric map of social vulnerability in Belgium

Mapping bivariate relationships with R

Spatialpoints analysis and visualization of sub-Saharan African health facilities
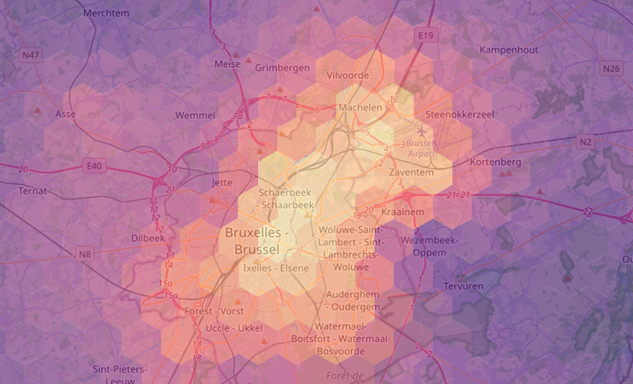
Spatial hexagon mapping of commute patterns in Belgium

Network visualization of climate-related conversations on Twitter

Mapping the Flemish election landscape : An alternative visualization
Even before AI existed, we’ve been dreaming about it in books and film. What can these representations tell us about the potential opportunities and pitfalls of this technology?
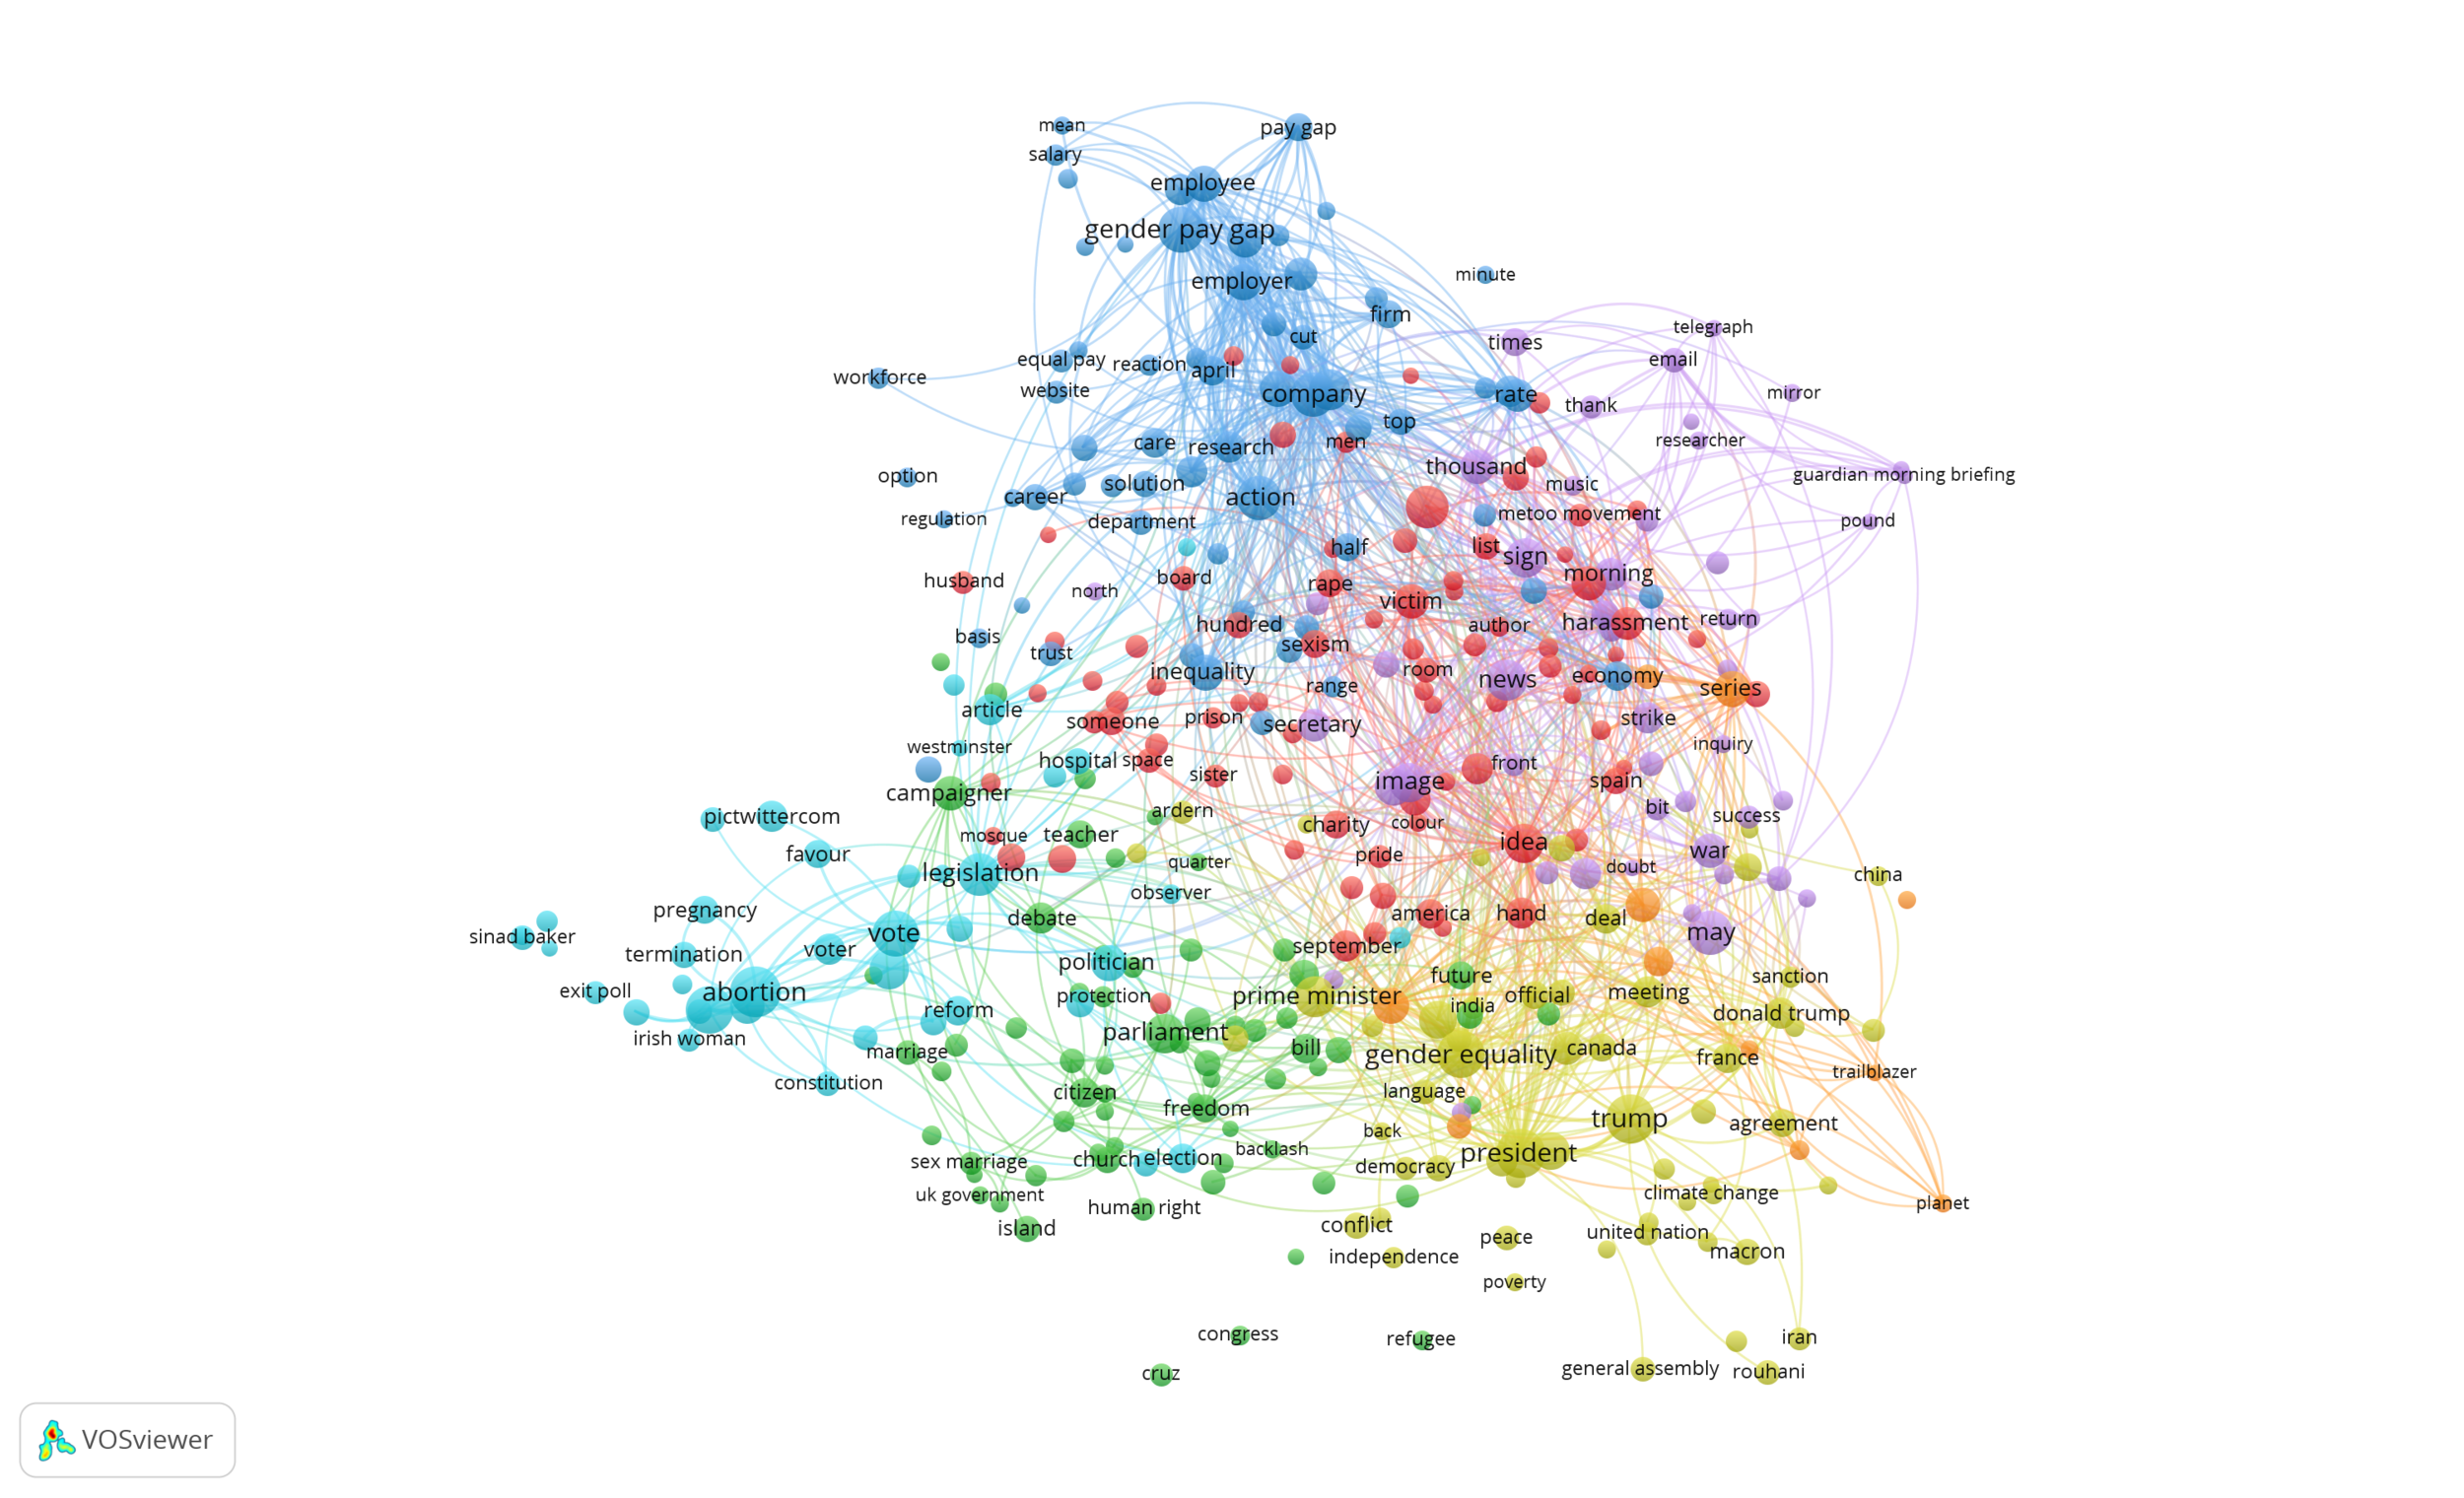
Discovering relationships in textual data : Exploring text mining with VOSviewer and Wordij : Part 1

De evolutie van de ruimtelijke ordening in België (1970-2015) en de effecten op het woon-werkverkeer

Text mining of social media content
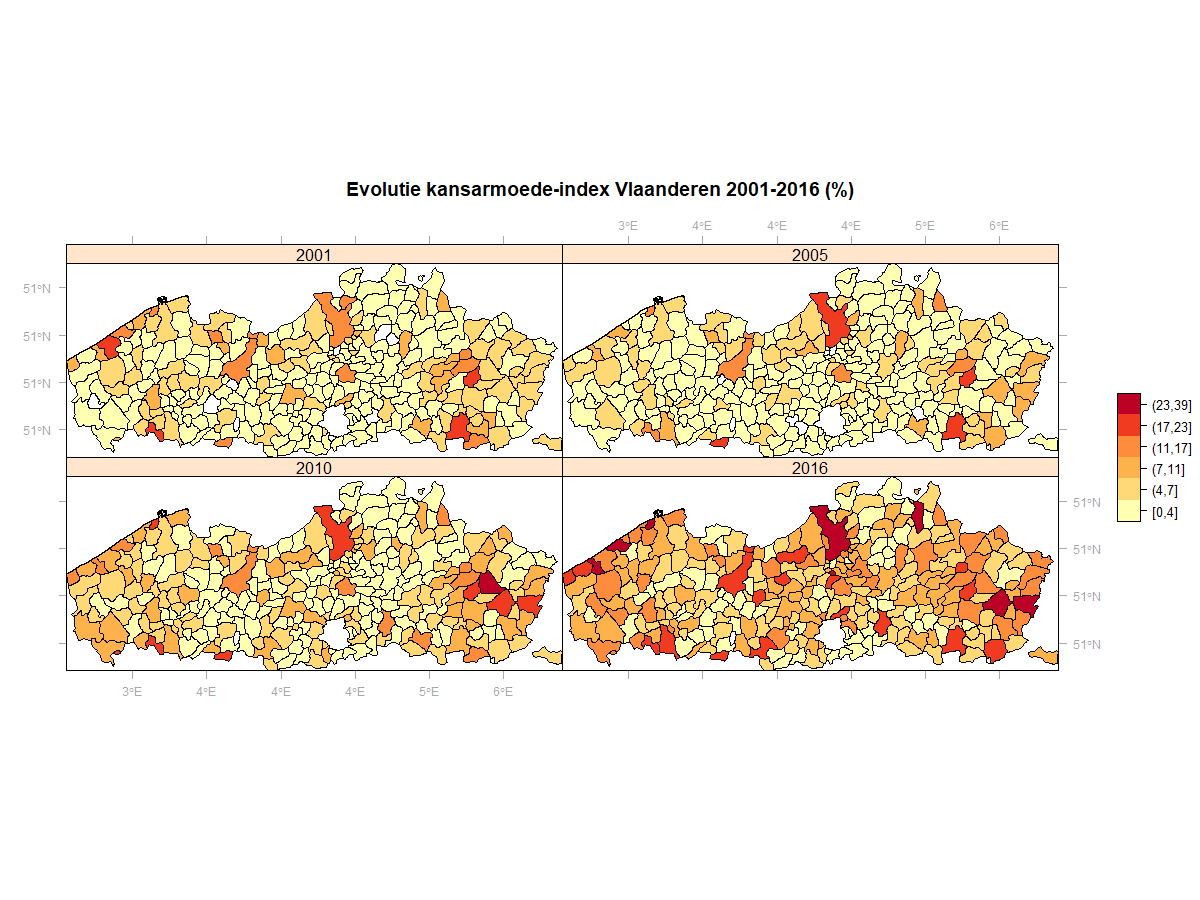
Evolutie van de kansarmoede in Vlaanderen, 2001-2016

Geodemographic classification of local communities in Belgium : The construction of an index of social deprivation
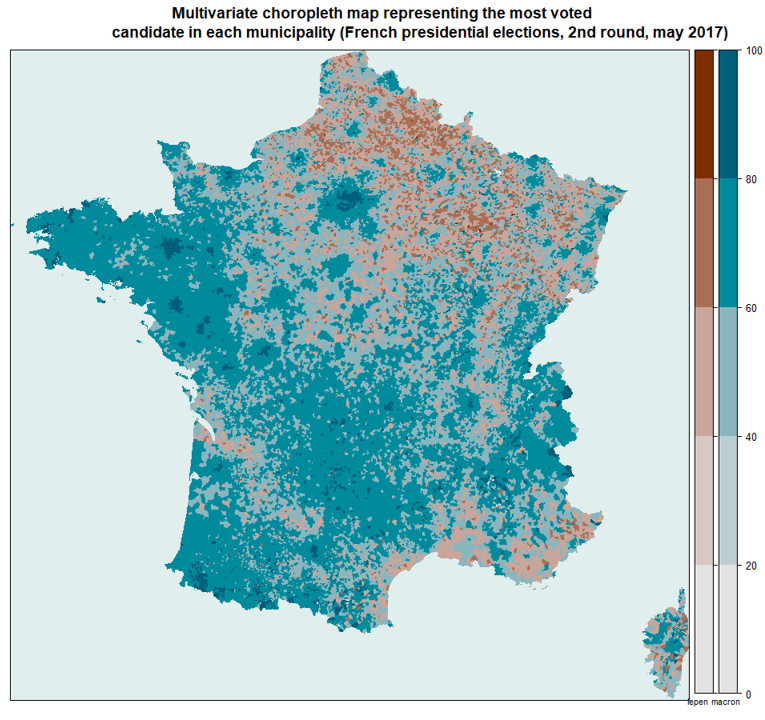
Mapping the results of the French presidential elections 2nd round, may 2017

Quality of life and voting behaviour

Text mining of State of the Union Adresses of Barack Obama, 2009-2016 : Sentiment analysis with R package “syuzhet”

GIS-based spatial modeling of crime

Visualisaties van het woon-werkverkeer in België
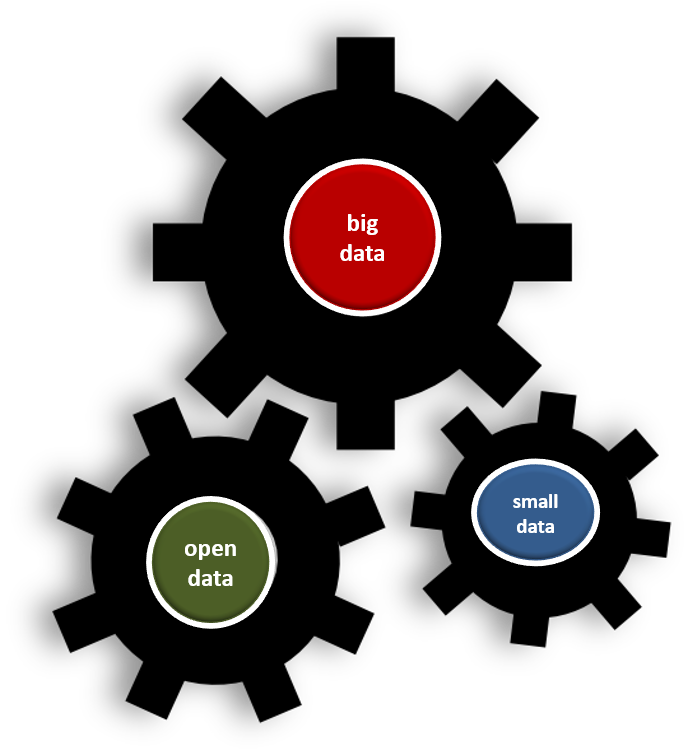
Big data, open data, small data
